
This article introduces an implementation of a simplified filtering algorithm that was inspired by Kalman filter. The Arduino code is tested using a 5DOF IMU unit from GadgetGangster – Acc_Gyro . The theory behind this algorithm was first introduced in my Imu Guide article.
The Acc_Gyro is mounted on a regular proto-shield on top of an Arduino Duemilanove board.
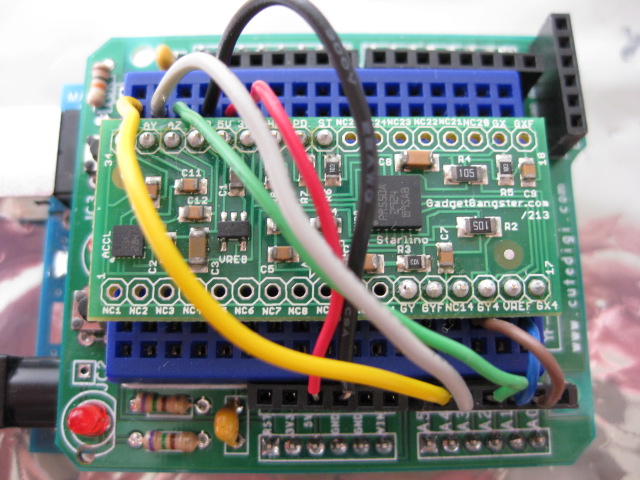
Parts needed to complete the project:
– Arduino Duemilanove (or similar Arduino platform)
– Acc_Gyro IMU board
– Protoshield (optional)
– Breadboard
– Hook-up wire 22AWG
The hook-up diagram is as follows:
Acc_Gyro <—> Arduino
5V <—> 5V
GND <—> GND
AX <—> AN0
AY <—> AN1
AZ <—> AN2
GX4 <—> AN3
GY4 <—> AN4
Once you have completed the hardware part, load the following sketch to your Arduino.
Run the project and make sure you are receiving an output on your serial terminal (you can start the terminal from your Arduino IDE).
To analyze the data I have developed a small utility called SerialChart. It is open-source so feel free to customize it for your own needs.
Here is the output from SerialChart software:
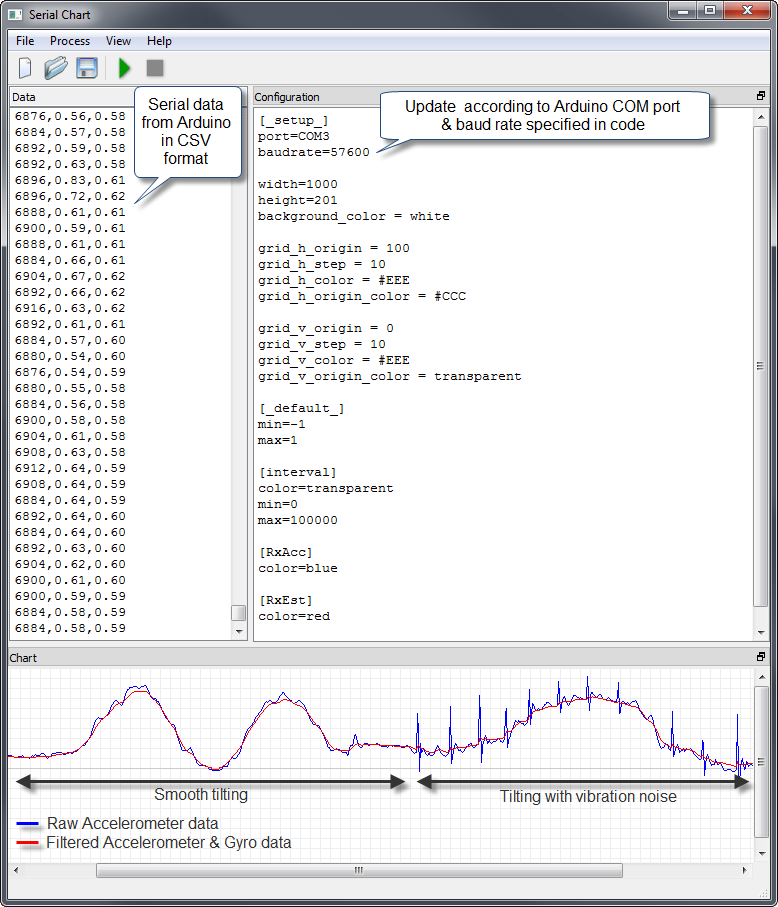
The test was performed as follows:
– first I was tilting the board slowly (marked "smooth tilting" on the screenshot)
– next I continued tilting the board, but I also started applying some vibration – by tapping the board quickly with my finger (marked "Titlting with vibration noise")
As you can see from the chart the filtered signal (red line) is indeed more immune to noise than the accelerometer readings alone (blue line). The filtered signal was obtained by combining the Accelerometer and Gyroscope data. Gyroscope data is important, because if you would simply average the Accelerometer data you would get a delayed signal. Given the simplicity of the code and of the algorithm I am satisfied with the results. One feature that I would like to add is compensation for the drift effect that you might encounter with some gyroscopes. However the Acc_Gyro board proved to be very stable in this respect, since it has built-in high pass filters.
If you'd like to experiment on your own, I recommended first reproducing this testing setup , then shift slowly towards your application needs. For example you may take the C code and port it to PIC's C18/C30 or AVR-GCC (it shouldn't be too dificult).
Below are some useful resources and their descriptions.
SerialChart executables can be downloaded from here:
Once you start SerialChart application you will need to load the imu_arduino.scc configuration file for this project(included in the imu_arduino.zip) archive.
In this configuration file make sure to update the 'port' settings to Arduino's COM port. On my computer Arduino was detected on COM3, on yours it might be different.
For more information on configuration file syntax see:
http://code.google.com/p/serialchart/wiki/ConfigurationFileSyntax
You can also download and compile SerialChart from Google Code:
http://code.google.com/p/serialchart/source/browse/#svn/trunk
You will need a SVN client to checkout the code (I use RapidSVN for Windows).
SerialChart was developed using Qt SDK from Nokia: http://qt.nokia.com/downloads
UPDATE 2010-03-18
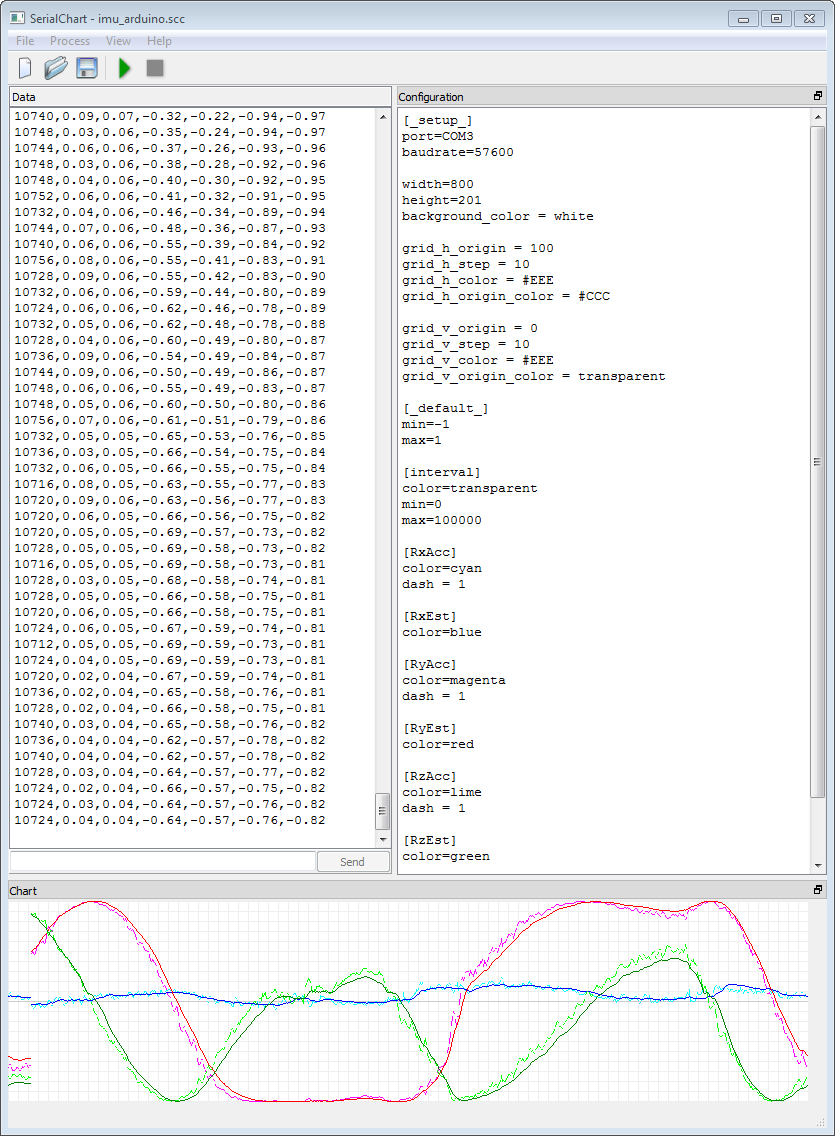
Many people ask me what about the other 2 axis, here is the code that outputs 3 axis, including the SerialChart configuration script.
Imu_Arduino_3axis_output_2010-03-18.zip
I also removed some overhead code that Alex pointed out in the comments, this reduced the interval between samples.
In the example below I rotate the board around the X axis(blue) which is parallel to the ground.I do it by hand so X is not exactly 0, but close. The axes that change are Y(red) and Z(green). Please note the relationship X^2+Y^2+Z^2 = 1. The dashed cyan, magenta and lime lines are unfiltered signals coming from accelerometer alone (RwAcc).
//starlino//
I really like the Serial Chart application but need some help with the configuration. Could you post a little more on how you configure it?
I added a Wiki page on Google Code project page describing the SerialChart configuration file syntax:
http://code.google.com/p/serialchart/wiki/ConfigurationFileSyntax
Home this helps.
This is truely a very informative article about this subject. Thank you. I don’t get something though: Is it right that you only read one axis? I would like to read both x and y axis inclination and think this should be possible with the set up.
Rob: sure you can add the other axis to the output, update the loop() function as follows:
getEstimatedInclination();
Serial.print(interval); //microseconds since last sample, please note that printing more data will increase interval
Serial.print(“,”);
Serial.print(RwAcc[0]); //Inclination X axis (as measured by accelerometer)
Serial.print(“,”);
Serial.print(RwEst[0]); //Inclination X axis (estimated / filtered)
Serial.print(“,”);
Serial.print(RwAcc[1]); //Inclination Y axis (as measured by accelerometer)
Serial.print(“,”);
Serial.print(RwEst[1]); //Inclination Y axis (estimated / filtered)
Serial.println(“”);
And , then in the serial chart configuration define the additional columns:
….
[interval]
color=transparent
[RwAccX]
color=blue
[RwEstX]
color=red
[RwAccY]
color=cyan
[RwEstY]
color=magenta
I tried this before, but the x and y sensor data seem to be inversely proportional to one another on both axes. I will tinker some more.
I just got my IMU from Gaget Gangster…and looking to start experimenting with my arduino!
I have a question. My first question was answered to your reply to Rob, but how would I grab the z axis information, and more so filter it using the gyro?…Is there an output for GZ4??
The reason I’m asking; I’m attempting to build a remote head tracking system for first person video in RC planes…I know almost nothing about electronics, but the arduino is making the learning curve much shallower! Ive learned a lot in the past couple of weeks…my background is coding, so i had a head start there…
I origionally started with the memsic 2125 acc. and got all I could with that 2 axis acc…i quicly relaized i NEEDED the z axis for the lateral head movement (shake your head no axis :D )…
So How do i get and filter the z axis on this thing?!? hehe!
Any help would be most appreciated…
Keith
Keith,
the device described in this article is otherwise know as an inclinometer, it measures inclination of the device relative to the ground plane. An IMU unit can have many uses – this is just one of them.
An inclinometer will sense if you tilt the device left/right or forward/backword, but it will not give you absolute information as to the heading of the device North/South/East/West.
You can get some information regarding the rotation around the gravitation vector (the line perpendicular to earth’s plane) using the gyroscopes, but gyroscopes only give you relative information, in other words it will tell the speed of rotation, you can integrate these results over a period of time , but without a fixed reference (for N/S/E/W) you will accumulate error over time.
If you absolutely need your device to react to rotation around gravitation vector, you would need to invite a magnetometer to the party. It will provide you a rough reference point from time to time where your device is heading (N/S/E/W), and then you can use gyro’s for fine tuning just like you do for accelerometer+gyro combo.
Acc_Gyro is a 5DOF unit, it has a 3-axis accelerometer and a 2-axis gyro (that’s why there are no GZ outputs). This is enough to implement an inclinometer. For the “ultimate” IMU device , that would also tell you if you’re headed N/S/E/W , you will need 2 more sensor: one more gyro for Z axis and a 3-axis magnetometer.
If you’re not ready for more investments, you can still use an inclinometer to control your plane – you should just avoid the rotation around the gravitation vector axis (line then goes from zenith down , perpendicular to earth’s plane).
If you’re standing up try to define your neutral point not the position where the head is in upward position, but the position where you head is tilted forward (or upward) 45 degrees. This way when you tilt your head you will no longer rotate around gravitation vector, ideally to make maximum use of the gravitation vector as a reference, you would be lying face down, or face up, this way inclinometer would sense every movement of the head with maximum resolution. So getting into an Avatar is still possible with an Acc_Gyro inclinometer , you just have to lie down , just like in the movie :)
If you can’t move the body in this position, then move your device – instead of a head mounted screen , consider a hand-held LCD screen that is hold in horizontal position and tilted to control the plane. This might kill some thrill of the project , i.e. the sensation of flying, but there are cost benefits to consider, and maybe also safety since you can still see what’s going on around you. This might also be an intermediary stage of your project, and when you mastered it you can move on to incorporating more sensors (magnetometer and extra gyro axis).
Starlino,
After a couple of days of messing around with your 5dofImu. I cant seem to reproduce your results in the serial chart program. (I really have to toss it around to get a reading)…moreover, tilting the device on either the X or Y Axis doesnt produce a definitive difference in data…if i tilt the device 45 degrees the serial data might change .01… can you shed some light on what i may be doing wrong.
RwAcc[0], RwEst[0]
-0.58,-0.47
-0.58,-0.50
-0.58,-0.53
-0.58,-0.57
-0.58,-0.60
-0.58,-0.63
-0.58,-0.64
-0.58,-0.66
-0.58,-0.67
-0.58,-0.69
-0.58,-0.70
-0.58,-0.70
My goal is to produce a device similar to:
http://vimeo.com/2590122
Im not looking to control the plane’s heading, just to control a camera on board…by moving my head, the camera will move…a UAV is the 20th step for me…
I just need to harness that “Yaw” movement, and I dont know enough to make it happen.
Thank you for any help!
Keith,
can you please also output and post the raw analog readings values an[0]..an[5], while holding device in stable horizontal position.
Also it makes sense to check you ACC_GYRO outputs with a multimeter, voltages you should check are: AX,AY,AZ, GX4, GY4
Please post the results here and we’ll go from there.
ok, here are the analog readings:
an[0]: 28, an[1]: 26, an[2]: 27, an[3]: 254, an[4]: 309, an[5]: 256
an[0]: 28, an[1]: 26, an[2]: 27, an[3]: 253, an[4]: 329, an[5]: 256
an[0]: 27, an[1]: 26, an[2]: 27, an[3]: 254, an[4]: 287, an[5]: 256
an[0]: 27, an[1]: 27, an[2]: 27, an[3]: 255, an[4]: 246, an[5]: 256
an[0]: 27, an[1]: 27, an[2]: 27, an[3]: 252, an[4]: 272, an[5]: 256
an[0]: 28, an[1]: 27, an[2]: 27, an[3]: 252, an[4]: 231, an[5]: 256
an[0]: 28, an[1]: 26, an[2]: 27, an[3]: 253, an[4]: 186, an[5]: 256
an[0]: 27, an[1]: 27, an[2]: 26, an[3]: 253, an[4]: 195, an[5]: 256
an[0]: 27, an[1]: 27, an[2]: 26, an[3]: 251, an[4]: 191, an[5]: 256
an[0]: 28, an[1]: 26, an[2]: 26, an[3]: 252, an[4]: 177, an[5]: 256
an[0]: 27, an[1]: 26, an[2]: 26, an[3]: 251, an[4]: 197, an[5]: 256
an[0]: 27, an[1]: 27, an[2]: 26, an[3]: 253, an[4]: 239, an[5]: 256
an[0]: 28, an[1]: 26, an[2]: 25, an[3]: 252, an[4]: 332, an[5]: 256
an[0]: 27, an[1]: 26, an[2]: 26, an[3]: 254, an[4]: 309, an[5]: 256
an[0]: 27, an[1]: 25, an[2]: 26, an[3]: 252, an[4]: 323, an[5]: 256
an[0]: 27, an[1]: 26, an[2]: 26, an[3]: 253, an[4]: 320, an[5]: 256
an[0]: 27, an[1]: 26, an[2]: 25, an[3]: 255, an[4]: 304, an[5]: 256
an[0]: 27, an[1]: 26, an[2]: 25, an[3]: 254, an[4]: 277, an[5]: 256
an[0]: 26, an[1]: 26, an[2]: 26, an[3]: 252, an[4]: 307, an[5]: 256
an[0]: 27, an[1]: 25, an[2]: 26, an[3]: 254, an[4]: 254, an[5]: 256
an[0]: 27, an[1]: 25, an[2]: 26, an[3]: 252, an[4]: 209, an[5]: 256
an[0]: 27, an[1]: 26, an[2]: 25, an[3]: 250, an[4]: 210, an[5]: 256
here are the 3 axis readings:
RwAccX: -0.58, RwEstX: -0.57, RwAccY: -0.58, RwEstY: -0.63, RwAccZ: -0.58, RwEstZ: -0.53
RwAccX: -0.58, RwEstX: -0.57, RwAccY: -0.58, RwEstY: -0.63, RwAccZ: -0.58, RwEstZ: -0.53
RwAccX: -0.58, RwEstX: -0.57, RwAccY: -0.58, RwEstY: -0.63, RwAccZ: -0.58, RwEstZ: -0.53
RwAccX: -0.58, RwEstX: -0.57, RwAccY: -0.58, RwEstY: -0.63, RwAccZ: -0.58, RwEstZ: -0.53
RwAccX: -0.57, RwEstX: -0.57, RwAccY: -0.58, RwEstY: -0.63, RwAccZ: -0.58, RwEstZ: -0.53
RwAccX: -0.58, RwEstX: -0.57, RwAccY: -0.58, RwEstY: -0.63, RwAccZ: -0.58, RwEstZ: -0.53
RwAccX: -0.58, RwEstX: -0.57, RwAccY: -0.58, RwEstY: -0.63, RwAccZ: -0.58, RwEstZ: -0.53
RwAccX: -0.58, RwEstX: -0.57, RwAccY: -0.58, RwEstY: -0.63, RwAccZ: -0.58, RwEstZ: -0.53
RwAccX: -0.58, RwEstX: -0.57, RwAccY: -0.58, RwEstY: -0.63, RwAccZ: -0.58, RwEstZ: -0.53
RwAccX: -0.58, RwEstX: -0.57, RwAccY: -0.58, RwEstY: -0.63, RwAccZ: -0.58, RwEstZ: -0.53
RwAccX: -0.58, RwEstX: -0.57, RwAccY: -0.58, RwEstY: -0.63, RwAccZ: -0.58, RwEstZ: -0.53
RwAccX: -0.58, RwEstX: -0.57, RwAccY: -0.58, RwEstY: -0.63, RwAccZ: -0.58, RwEstZ: -0.53
RwAccX: -0.58, RwEstX: -0.57, RwAccY: -0.58, RwEstY: -0.63, RwAccZ: -0.58, RwEstZ: -0.52
RwAccX: -0.58, RwEstX: -0.57, RwAccY: -0.58, RwEstY: -0.63, RwAccZ: -0.58, RwEstZ: -0.52
RwAccX: -0.58, RwEstX: -0.57, RwAccY: -0.58, RwEstY: -0.63, RwAccZ: -0.58, RwEstZ: -0.53
RwAccX: -0.58, RwEstX: -0.57, RwAccY: -0.58, RwEstY: -0.63, RwAccZ: -0.58, RwEstZ: -0.53
RwAccX: -0.58, RwEstX: -0.57, RwAccY: -0.58, RwEstY: -0.63, RwAccZ: -0.58, RwEstZ: -0.53
RwAccX: -0.58, RwEstX: -0.57, RwAccY: -0.58, RwEstY: -0.63, RwAccZ: -0.58, RwEstZ: -0.52
RwAccX: -0.58, RwEstX: -0.57, RwAccY: -0.58, RwEstY: -0.63, RwAccZ: -0.58, RwEstZ: -0.52
My multimeter isnt working sorry…
can you tell anything from what I gave you?
Thanks! Keith
Keith,
It looks like accelerometer values are way off ,
an[0] (AX), an[1] (AY) should be around 1.65V / 5V * 1023 = 337.59
When you get a multimeter, please remove the Acc_Gyro from your project power it with 5V power source on 5V and GND pins. Then measure the voltage between GND and AX, AY. When Acc_Gyro is in horizontal position they should be around 1.65V.
Your serial chart application is a must !
It did not manage to use the port COM18 of the Arduino I use. After some tweaking in Windows, I changed it to port COM2 and it works very fine. I’m sure it will help me a lot to develop a specific IMU for my tricopter, as well as your simplified Kalman filter code.
I noticed a small mistake in your code, with no consequence in the computation result:
//reverse calculation of RwGyro from Awz angles, for formulas deductions see http://starlino.com/imu_guide.html
for(w=0;w<=1;w++){ RwGyro[0] = sin(Awz[0] * PI / 180); RwGyro[0] /= sqrt( 1 + squared(cos(Awz[0] * PI / 180)) * squared(tan(Awz[1] * PI / 180)) ); RwGyro[1] = sin(Awz[1] * PI / 180); RwGyro[1] /= sqrt( 1 + squared(cos(Awz[1] * PI / 180)) * squared(tan(Awz[0] * PI / 180)) ); } I suppose you wanted to mutualize the code in the loop, but this way it is done twice. I also noticed the sensibility scaling of the ACC is useless in your formulas if it is the same on the 3 axis because of the vector normalization.
Hello, Starlino first of all congratulations for your work and for share it with the world. I implemented this code and noticed some that I want to ask you. It might be doubt of others readers too. With this code when you are monitoring only one angle (Roll or Pitch) it works perfectly, like the picture previously shown. But when you capture the two angles (Pitch and Roll) at the same time, the rotation of one influences a lot on the estimation of the other.
Let me be more clear, for instance if I rotate my IMU only over the X axis, I see the Pitch angle (formed by axis Y and the gravity vector) angle changing perfectly of 0º to 180º, but the Roll angle (wich was supposed to stay in zero all time) changes too. I believe its a effect of the filter but I didin’t found this relation. Can you give a tip of how change this variation or minimize her?
Another question. Do you know a method to put this angle variation of 0º to 360º?
Thank you.
Lucas,
if you rotate the board around one axis for example (X) , only the other 2 axes should change. I included code and a screen shot in the article update “2010-03-18”, see above (You are right many people ask same question).
You can get a 360 degree angle (around one of the axis, for example X) by using atan2(RyEst,RzEst), it will return an angle between -PI to PI in radians (or -180 to 180 in degrees).
If you can’t reproduce this exactly with your sensors, I recommend to start the Acc_Gyro sensor then migrate the code to your sensors.
Why did we get the reference voltage as 5 V? Because in the datasheets of the accelerator and gyroscope they both get about 3.3 V voltage input. Shouldn’t we assign reference voltages according to datasheet input voltages?
Ozan ,
we use 5V because this is the reference voltage of the ADC module of Arduino. In other words 5V will correspond to a maximum value of 1023 that can be theoretically returned by the analog read. The Acc_Gyro will obviously never go over 3.3V so the remaining range of ADC (up to 5V) is simply unused.
On the UsbThumb(it’s a PIC platform that mates with Acc_Gyro) on the other hand the entire range of of ADC is used because it is powered by 3.3V.
This write-up is absolutely brilliant. I have never built/programmed an Arduino (or any PCB) device before. However, I was able to read these instructions, buy the parts and put it all together.
With that said, it looks like you take what would have been an analog output and convert it to digital to then provide a readable serial output. I would like to output an analog (or PWM) 0.0 – 5v (range 0 – 45 or 90 degree tilt) signal that I can feed into another device.
Would that be easy with this code? Is there somewhere I could read up more on this to find out what in your code needs to be modified to do this?
I really like this article and some others (about the theory of IMU, programming & soldering tips for PIC by instance).
I have tested your code with the IMU and a dsPIC33FJ128GP802. I’m quite impressed by the kalman filter! Without your code I thought I had no chances to program this filter in less than few months (I try to use the “simple” PID filter of the dsPIC33F). It works great, however since it is for an UAV (Quadcopter) I think that the lack of Gyro drift compensation might be annoying (I haven’t tested in flight for that reason :D ).
Your article about the IMU deals with combining gyro and accelerometer datas, but I haven’t found something about the drift!
I’am also thinking about a 3rd axe for the gyro (soldering a new gyro on a separate board), but it might be useless…
So if you have got informations about the drift compensation or the 3rd axe, it would be kind to help me.
Best regards
Ilco:
About the 3rd gyro axe – you’ll need to stabilize yaw rotation. They are cheap , Pololu has one for 17.95 http://www.pololu.com/catalog/product/765 .
There are 2 types of gyro drift often confused, one is that results from integrating the gyro readings over a period of long time in gyro-only systems. This is not the case with the algorithm described in this article since gyro is only integrated over a short period of time (older values simply fade out as they are combined with accelerometer readings).
The other type of gyro drift is caused by the fact that gyro outputs a zero-point that differs from the specs, sometimes it even changes over time (not with Acc_Gyro that has a low pass filter that takes care of this). The Acc_Gyro is pretty stable in this respect, so if it’s spec zero-point is 1.23V you can expect an actual zero-value in range of 1.22..1.24. A module I have from Sparkfun on the other hand goes all the way to 1.11V, I guess it’s the difference between the reflow process that causes these differences with same sensors. Long story short, don’t trust the specs – before you start your device you should calibrate the zero-values of your gyro. For example ask the user not to move the device on start-up, blink a led for status, monitor for gyro values being relatively stable and the read the actual zero-value (mid value not average is recommended). You can store these values in EEPROM for future use. With Acc_Gyro I haven’t seen much variation over time or temperature. So if you determine your Acc_Gyro gyro’s zero value to be for example 1.239 ,it will be like this even after a month or two.
I think the real problem you’ll have with a quadcopter is the noise from the motors. I am working on a similar design (also based on dsPIC33FJ128GP802), and I am planing to solve this by taking more ADC samples than is possible with Arduino, using PIC’s DMA access to fill a memory location , then average them every 3 ms and feed the average values to the algorithm in this article. The algorithm itself has a property of smoothing the inclination readings as shown on the SeriaChart screenshot, but I think the increased sample rate and averaging that is possible to do with the PIC will help even more (it’s like having a separate thread in the background collecting ADC samples , while your main code thread is doing something else). If you want I can share the ADC code for DMA readings on dsPIC33FJ128GP802. I’ll probably have more info on other issues as project progresses, also since we’re using same chip I am open to cooperate on the project with you or other people.
Thank you very much for this, it helped me greatly understand how a kalman filter works, your code is very well commented and very clean.
hello, i’m tryng to do some similar as you with arduino and imu board (accel+gyros), and I have seen the serial chart project. I have few questions:
1.The serial chart project belongs to starlino?
2.Anyboy knows with wich IDE has been programated serial chart?
3.Is needed some colaboration with them?
thank you
Awesome, exactly what I’m looking for! I want to use this in a car to determine body roll in cornering, braking and accelerating. Will this get messed up by the g-forces of the car accelerating in the x and y directions? I’m pretty sure it would be messed up and there’s not much that could be done about it but I figured I’d ask if you had a way around it.
Thanks!
Hi,
Just a quick note, the Serial Chart program does not work with COM ports above 9.
It just says there is an error and that the COM port is not available.
Changing the COM port in device manager to a port below 9 fixes this issue.
Thanks
Pingback: BaronPilot - Autostabilizzatore Molto Economico - Pagina 58 - BaroneRosso.it Forum
Pingback: OSD de remzibi - Page 38 - Modelisme.com
Pingback: WWW.Analyst-TW.com » Pic based quad controller
Hello, I am new in this topic.
I have been studying your C code in Arduino. Could you explain what the next structure mean –>
struct{
code,
code,
code}
config;
Regards!
Sam it’s a C structure see here: http://publications.gbdirect.co.uk/c_book/chapter6/structures.html
Thanks !! :D
I have a another question: on the next for structure, Why are you using w as the evaluated variable. In the next formulas, you are NOT using [w]’s to insert it. :/
for(w=0;w<=1;w++){
RwGyro[0] = sin(Awz[0] * PI / 180);
RwGyro[0] /= sqrt( 1 + squared(cos(Awz[0] * PI / 180)) * squared(tan(Awz[1] * PI / 180)) );
RwGyro[1] = sin(Awz[1] * PI / 180);
RwGyro[1] /= sqrt( 1 + squared(cos(Awz[1] * PI / 180)) * squared(tan(Awz[0] * PI / 180)) );
}
Sam, this overhead code was already pointed out by Alex in comments and fixed in UPDATE 2010-03-18. Thank you !
Hello,
First cangrats for your work! Im trying to use it with the 6dof razor IMU. I connect it with arduino leaving the Gz pin from the imu unconnected. Below is my results with the 6dof imu. It seems to filter very nice the data, my only problem as you can notice is that i have a small delay. Do you know why is that?
http://img535.imageshack.us/img535/7411/6dof.jpg
If you get a delay decrease wGyro value, also make sure your gyro is sending correct data (you can use serial chart to chart it ).
I hate to be “that guy”, but there is nothing similar to a kalman filter in that code. :( The whole point of a kalman filter is that it continuously adapts the weights for the averaging using the covariance. Without that it’s just a linear dynamic system with a low-pass filter.
Andres, this is correct , THIS IS NOT KALMAN filter, the filter in this article can be found it in literature as “complementary filter”. To quote myself , I like to call it “simplified Kalman filter”, but you don’t have to. I call it this way because of the same principles of weighted fusing of post and pre-estimates, however as you noted the real Kalman filter will update the coefficient matrix which this filter does not (by default). I also call it this way so people looking for an alternative to Kalman can find it. Hope this clarifies the subject.
Also related to Andres note here is a a nice comparison of a Complementary filter and Kalman filter http://www.youtube.com/watch?v=HzkSJKIBofs , if you scroll the time line to 1:39 where he moves the board from left to right you’ll see that Kalman filter is not so immune to external acceleration (the gauge obviously shows too much inclination) , extended Kalman seem to be better.
I was mainly replying to a couple of commentators (18 and 20) who seem to be under the impression that this was a kalman filter, and the fact that there already is something called “simple kalman filter” I think adds to the confusion. :)
You can’t learn how these filters work from looking at code, you really have to do the legwork and learn the math (stochastic processes, matrix calculus, dsp etc).
After that I suggest learning the scalar kalman filter first: http://www.swarthmore.edu/NatSci/echeeve1/Ref/Kalman/ScalarKalman.html then moving on to higher order filters: http://www.swarthmore.edu/NatSci/echeeve1/Ref/Kalman/MatrixKalman.html
hello starlino,
can you give some advice on the port assignments on that serial chart? it was mentioned above (in the comments) that it will not read ports above 9 and unfortunately, on my laptop, the port assigned to the arduino is com25. can u help/suggest on how do i make/change the port assignment of my arduino to lower ports?
Hi Starlino,
I wanted to thank you for posting this! It is going to save me a ton of time getting an initial setup working. You do good work and I appreciate you sharing!
Hi Starlino, hi everybody.
Just to let you know that I’ve implemented this algorithm with Arduino & Processing with an ADXL345 and ITG3200 both on the arduino and on the host computer.
Every details at http://www.varesano.net/blog/fabio/my-first-6-dof-imu-sensors-fusion-implementation-adxl345-itg3200-arduino-and-processing
Hi,Dear Starlino
I should congratulate you because of your advantageous interactive approach. I have a question. Would you please advise me how can I save the received and indicated data in the SerialChart, in my computer hard disk?
I believe you can put 3.3V into your AREF pin on your Arduino and then the ADC will measure 0-3.3V rather than 0-5V. This will give you a little better granularity in the data. Juat make sure you change VDD to 3300 in the code
Yes 3.3V can be connected to AREF and then just add analogReference(EXTERNAL); in the setup() function. The ADC resolution will be better then.
Hi There!
I have built a segway, and have really enjoyed using your software to test the tilt of my device!
Anyway, in order to control the motors I am required to send a value between 1-125 to the left motor and 226-250 to the right motor (via a motor controller) for it to work, I have to date been able to “see/chart” each motor on the screen with your software!
Prior to now I have been setting a printf function in my code to allow it to send the left motor signal then the comma, then the right and then a new line (to facilitate the following config file)
So this is the output I have been using from a microcontroller to a computer
34, 229
35, 230
36, 231
etc…
works with this config no problems!
[_setup_]
port=COM3
baudrate=9600
width=1900
height=500
background_color = white
grid_h_origin = 0
grid_h_step = 10
grid_h_color = #EEE
grid_h_origin_color = #CCC
grid_v_origin = 0
grid_v_step = 10
grid_v_color = #EEE
grid_v_origin_color = transparent
[_default_]
color=red
min=-100
max=100
[tilt]
color=transparent
min=-100
max=100
[balance_torque]
color=transparent
[left_Sig]
color=red
min=-100
max=100
[right_Sig]
color=blue
min=-100
max=100
[RwGyro]
color=transparent
[GyroRate]
color=yellow
min=-100
max=100
[an3]
color=green
min=0
max=1023
My question is now (because of the motor controller I am using), I cant use commas and new lines, the way the code has to work is by sending the numbers in a contstant stream,
Like this
34 229 35 230 35 231 etc…
I was wondering if it is possible to write a config file that differentiates a value between certain points as one color and between another 2 points as another colour?
ie so values between 1-125 as red and 126-250 as blue? in 2 lines?
Thanks!
Aaron,
to make SerialChart work your own protocol you will need to implement a custom Decoder.
Here is how the default CSV decoder is implemented:
DecoderCsv::DecoderCsv(QObject *parent,Configuration* config) :
DecoderBase(parent,config)
{
}
void DecoderCsv::newData(const QByteArray& newBytes){ packetMaxLen){
for(int i=0;i
packetBytes.clear(); //discard packet
packetStarted = false;
}
}
}
}
};
void DecoderCsv::packetSeparator(){::iterator i;
packetStarted = true;
if(!packetBytes.isEmpty()){
packetParts = packetBytes.split(‘,’);
packetValues.clear();
QList
for(i=packetParts.begin();i!=packetParts.end();i++){
packetValues.append((*i).toDouble());
}
emit newPacket(this);
}
packetBytes.clear();
};
As you can see you need to create a class that overrides DecoderBase class. That implements two methods newData, and packetSeparator. In your case you can call packetSeparator(); when c > 125 as opossed to (13 == c || 10 == c) for CSV.
Once you create your class your decoder class you must
add this line
if(config->get(“_setup_”,”decoder”) == “mydecoder”)
return new DecoderMydecoder(parent,config);
in decoderbase.cpp > createDecoder(). Assuming you called your decoder “mydecoder” and your decoder class is DecoderMydecoder
After you compile the program you will be able to use your own new decoder in the SerialChart configuration file like this:
[_setup_]
port=COM3
baudrate=9600
decoder = mydecoder
…
You can also analyze other decoders that SerialChart currently supports for example
http://code.google.com/p/serialchart/source/browse/trunk/decoderhdlc.cpp
or
http://code.google.com/p/serialchart/source/browse/trunk/decoderbin.cpp
Entire source code for SerialChart is available here:
http://code.google.com/p/serialchart/source/browse/#svn%2Ftrunk
Once you create your decoder fill free to contribute to the source code if you think this is a widely used protocol that others will be interested in.
Good luck with your Segway, would love to see your finished product !
Hi, there,
I worked on the code for my 6DOF IMU, but I found out that when I change only in pitch, there is a relative rotation in roll. but once the change in pitch stopped, the roll comes back to correct position, any idea what I do wrong?
Hello,
Thank you for providing this code, but I am having trouble checking out the code from your repository. I am using TortoiseSVN and I get the following error (405 Method not allowed). Is there any additional steps I need to go through to get this to work.
Thank you for your time.
-Eric
Command: Checkout from http://code.google.com/svn/trunk/serialchart-read-only, revision HEAD, Fully recursive, Externals included
Error: Server sent unexpected return value (405 Method Not Allowed) in response to
Error: OPTIONS request for ‘http://code.google.com/svn/trunk/serialchart-read-only’
Finished!:
Try just : http://serialchart.googlecode.com/svn/trunk/ (there’s a space before serialchart-read-only that I don’t see in your comment)
That did it!
Thank you. I hope to use this to evaluate my latest set up.
Regards,
-Eric
Pingback: A Guide To using IMU (Accelerometer and Gyroscope Devices) in Embedded Applications. « Starlino Electronics
Hi Starlino,
Thanks for sharing the serial chart application. I’m using it now and it works really well. I just want to ask you one question. How do I know the delay time between the accelerometer signals and filtered signals? What is the timing of each block? Does it depend on width in configuration? If I choose 1000 and it shows 50 blocks. So does it mean each block has timing with 50ms?
Many Thanks,
The vertical and horizontal grid is measured in pixels , each pixel on the X axis corresponds to a line(sample) of data, the device dictates the interval between each line(sample), you can measure it on device and send it as the first value in the parameter. So you know for example that each pixel is 10ms. So if you have a grid of 50 pixels each block is 500ms. This is just an example calculation that hopefully clears out the X axis of the SerialChart.
Hi,
I am building a balancing robot (prototype for a Segway really) and using the IMU & Starlino code, however, I have a few queries:-
Using RwEstX I amd finding there’s too much lag and as a result my motors don’t respond quick enough. So, I have been trying RwAccX which is a good bit faster, but lose the benefits of Est.
On my Arduino (328 powered) I have measure my main loop scan time at over 5mS, which I believe doesn’t help much.
Finally, the output range of RwAccX/RwEstX is -1.00 to +1.00, and so by the time I multiply that up to suit my PWM output values required then I’m losing a good bit of resolution, especially around zero where the deadband created by such means my motors don’t react.
Any hints/tips?
Ian.
Update:
Deadband I mention is due to cheap motor/gearbox combo.
Ian.
Hi,
I am building my final project that using accelerometer, i am using your Serial Chart but i have some problems with it,
first, why it response (due to the changing of accelerometer value) become so slow.. my input for serial are :
320,333,367
320,333,367
319,333,367
319,333,366
320,333,367
320,333,366
319,332,366
320,333,367
319,333,366
320,332,366
(represented my analog read of accelerometer using arduino..)
Second, i want to make my chart to be more ‘zooming’so it will make the detail of the chart bigger,
could you help me how to do/fix those things?
Regards
Nanda Fathurrahman
Wireless Sensor Laboratory EEPIS
wsn.eepis-its.edu
1) For slowness, try to introduce a delay after sending each line (in Arduino code) of at least 10ms to allow computer to process it.
2) To zoom in / out use the min/max values in [_default_] or [Field] sections to specify which value corresponds to the top of screen (max) and which value correspond to the bottom of the chart (min). For accelerometer try min=256 , max =768 (assuming mid-value is 512).
Okay.. it works… Thank You very much!
Just to say i have only just started to play with the arduino and set my self the task of building a balancing robot ,,,i would like to say big big no massive thankyou for publishing your code and software i have made the 1st steps in my project build and thanks to your work i may actually make this damm thing work LOL :-) you code is excellent and gonna be a great help to me with my project big up praises to you and all the guys that contribute — some one said arduino rocks well i say your stuff is volcanic ( corny i know but just glad you explained so difficult stuff in laymans terms ) cheers :-)
Do you know Objective C for the iPhone4? If so, would you be willing to write an app using that device’s accelerometer and gyro to get x,y,z,t coordinates, which come in 1/n , where n=10, 20, 60, so 60 readings per second?
I’m a novice programmer, and just getting the data is hard. If you don’t do it, or don’t have the time, do you know anyone knowledgeable on the iPhone4 who might help me?
Thanks,
Pete
Pete, as a matter of fact I know Objective C and I experimented with it, the main challenge would that the emulator that comes with XCode obviously cannot simulate the accelerometer, so there are some tricks how to simulate this data. I approved your comment so if anyone is interested and they post here – I will forward them to you. If the job is paid well – I might take it ( you can write me in private at contact [at] starlino.com so we can discuss in detail).
Hi,
What is the purpose of tmpf *= interval / 1000.0f?
I get what it does (multiply tmpf by time stamp difference once divided by 1000 for unit conversion?), but how does that actually calculate the angle change in degrees?
Thank you,
Keehun
Sorry, I get it now. You’re multiplying the rate by the time which has elapsed. Which ultimately results in just degrees.
hello, as nunchuk data convert to angles?
hola,ante todo gracias por su pagina y dedicación. mi consulta es la siguiente. en mi proyecto necesito colocar por razones de espacio la placa de un 5DOF IMU en posición vertical, no horizontal ¿es posible cambiar la orientación de los ejes por software? para situarla en esa posición. utilizo su programa que implementa el filtro Kalman. Gracias por su atención, y un sincero y cordial saludo
Hi, I’m working on 6DOF IMU sensors and found this application (SerialChart) very useful.
This post just to submit an issue about SerialChart. Having multiple USB/serial transceiver (i.e. FTDI chip) connecting different development boards, the virtual COM number assignement may grow quickly. In my case using COM5 I can connect the serial port but usign COM19 I can’t: SerialChart returns a message box error “Could not open port COM19”.
Could be a bug in the COM port configuration parser that only forsee COM port names ranging from COM1 to COM9? I get the same messages with all COM port with two digits number.
Pingback: DCM Tutorial – An Introduction to Orientation Kinematics « Starlino Electronics
Hi Starlino
I am trying to implement you serial chart in an application in order to observe the data of a accelerometer using a PIC24FJ64GB002, but my problem is that i use ANSI C for pic24f which doesn’t have the function Serial.print(). So is there any library or a method to do that?
Instead i used this code, but on the serial Chart i receive random symbols.
hdlc_send_float(Interval_msec);
uart_send_char(“,”); //
hdlc_send_float(Xaxis);
uart_send_char(“,”);
hdlc_send_float(Yaxis);
uart_send_char(“,”);
Pingback: Arduino code for IMU Guide algorithm | PyroElectro - News, Projects & Tutorials
Hi Starlino
I am trying to measure roll and pitch degree of moving object (sort of a cylinder).
I am bit of confuse, is that your algorithm can measure roll pitch degree of moving object?
Thank You
Hi Starlino,
Would it be possible to accept data from two seperate serial ports and plot the received data on one chart?
Also could we have a feature to add a scale(s) for X & Y axis?
Thanks
Barry
Barry: Multiple data sources would be an interesting feature , might add to the extended wishlist.
For scale you can use Pitch parameter, see:
http://code.google.com/p/serialchart/wiki/AdvancedFeatures
Hi,
First of all thank you so much for a wonderful introduction on the IC. I have been longing for such an IC. I am working on an inverted pendulum. I would like to know if i could use the output from the Gyro directly to compare my tilting in inverted pendulum.
Pingback: UDB4 UAV Geliştirme Kartı | Model Hobby Projects
Hi..I’m a student working on a Underwater Remotely Operating Vehicle where I’m using 5 DOF IMU to get the position of the vehicle. To interface with IMU Im using Arduino Uno micro controller.my problem here how i can get the position of the vehicle from the acceleration since the Arduino only gvs output of acceleration. How we can interface arduino wt MATLAB to use the arduino output to get the acceleration.
I recently bought an IMU (the one listed in the store with the yaw gyro board soldered on top), without fully understanding how IMUs function. What I really needed it for was for measuring yaw for an autonomous underwater vehicle I’m working on. I realize now that in order to get an accurate reading you need a magnetometer as well and use that along with a Kalman filter to get rid of drift. However I dont think that I need an accurate reading for more than 5-10 seconds (it would just be used for relative positioning while turning).
I attempted to just access the yaw gyro and use that solely, but am getting very bad results. I understand that gyros arent the most accurate sensor, but mine seems to be only good for detecting movement and doesnt give an accurate depiction on magnitude or direction of the angular velocity. For example I might start my program, rotate the board 90 degrees and then rotate it back and have the angle decrease upon both rotations. Furthermore my gyro never seems to settle back to the original zero. After rotating it and stopping it seems the zero voltage has changed and thus the gyro starts drifting really badly. I’ve tried fine tuning the zero voltage as closely as possible, but this doesnt really matter if its always changing. I’ve also played around with the parameters for the if statement but that only marginally helps..
So my question is, are gyros really THAT inaccurate? Or should I be getting something at least somewhat useable? Please check out my code and see if you can see any issues. Thank you!
float yawRate; //reading from the gyro
float yawZero = 1.255; //zero rate voltage
float currentAngle = 0;
void setup() {
Serial.begin(9600);
}
void loop() {
//Get the reading from the yaw gyroscope
yawRate = analogRead(A3);
//convert to degrees/second
yawRate /=1023;
yawRate *=5;
yawRate -= yawZero;
Serial.println(yawRate);
yawRate /=.002;
//if statement to help minimize drift
if(yawRate>5||yawRate<-5) {
//running at 100 Hz
yawRate /=100;
//add up the angles
currentAngle+= yawRate;
}
//ensure that the angle stays between 0-360 degrees
if (currentAngle 359)
currentAngle -= 360;
Serial.println(currentAngle);
delay(10);
}
Ok , couple of pointers:
– you must determine yawZero experimentally, don’t just use the datasheet value, you can write some code to measure it at startup (this is when the device is not moving), or hardcode it but make sure to update it periodically.
– I don’t think your loops is running at 100Hz because println take some time in addition to delay(10) use millis() arduiono function to measure time for each loop
Thanks for the reply. I did find the zero voltage experimentally (using a voltmeter and using println). I switched my code to using millis but I’m still getting the same issue as before. The gyro doesnt seem to return exactly to the same zero voltage after it moves. I dont think this is something you can adjust dynamically either so it might be a hardware issue and not software?
Robert: Can you please post your code again. When you say “gyro doesn’t return exactly to same zero voltage” do you mean the direct reading from GZ4 port,or the cumulative sum of angles ? Reposition the sensor and try another channel such as GX4 or GY4. You also have the non-amplified , non-filtered channels GX, GY that you can try. No gyro is perfect , that’s why they are used often with accelerometers (for inclination pitch/roll measurement) and with magnetometers for (heading / yaw calculations). If they would be perfect , people would not bother combining them. In any case if you find this sensor is not working for you , feel free to contact me via email to arrange a return.
can i use serialchart with motionnode?
Zam: I guess you could if it outputs serial data. You may need to develop your own “decoder” class for SerialChart if its packet data does not fit in any of the existing decoders of SerialChart (hex, binnary , csv).
Hi!
I have rewritten Your arduino code to AVR GCC and changed accelerometer/gyro to mpu6050. The “kalman filter” seems to be working :) But I have a question.
If I tilt my board and reset microcontroller, output goes to 0 and when I level my board output goes to -0.5.(The algorithem seems to be outputting relative rotation (relative to position when board was reseted) instead of absolute) Is this ok or have I made a mistake during porting?
I have solved previous problem. Turns out I made a mistake in porting. But now I noticed, that when I turn my IMU on one axis, the other axes rizes and the quickly falls down to 0. What could cause that?
I have migrated your source code to java. A video of the implementation can be seen here:
http://www.youtube.com/watch?v=gIB_hYhQ4FE
Source code:
http://code.google.com/p/un-robot/source/browse/trunk/pruebas/PruebaAtomicIMU/PruebaAtomicIMU/src/imu/controller/FiltroKalman.java
hi starlino.
i’ve tried your code. it works, thanx.
but i have problem when the board is upside down. the filter can’t predict well. is it true? or just mine?
i’m sorry if i’m re-asking this problem, because i didn’t read all comment above.
thanx.
jamal: can you please be more specific what the problem is when board is upside down.
when the board is in steady upside down position, RwEst data didn’t show correct angle. the data was oscillating.
Hi,
First of all congratulations, because this site is a reference for everyone who wants to start with IMU’s
I have two cuestions:
In your example, you didn’t say anything about the acc error to be removed. Could you explain how to remove the initial error? in my case, at the beginning i read:
0,10 0,12 0,99
and should be
0,00 0,00 1,00
The second cuestion is how to calculate the position in each time, because this is about the fusion of two sensor, but it would be good to have the position with this information too.
I guess the first step is to use:
S = V * T
Delta Position = Velocity * Delta Time
I need to convert G to Velocity, but i dont know how to do this.
Thank you for your help!
Regards
can u plz tell me the model number for these and also from where should order these in india.
To Pedro:
Only GPS can provide to you position of your device. You can not calculate it enough good using only accelerometer and gyro.
Hi starlino,
I like your software “serial chart” very much. I used it to analyse serial data from an arduino. It worked very fine with all arduinos before uno r3.
But this week I bought an arduino uno r3. Now I can’t analyse the data. It does not work with the uno r3. Perhaps because of the new “ATmega16U2” and the new driver.
There is always the message “Could open port COM11. ‘Make sure the port is availalbe…”
Is there a solution?
I have a PC and windows 7.
Thanks a lot.
Max from Germany
science teacher
max: was the previous arduino on a lower port such as (COM3, COM5), try to go to device manager and change assigned COM port from COM11 to something lower like COM3 / COM4 , some people reported problems with the ports higher than 10.
Hi starlino,
thanks for the tip. Now it works very well again.
It is a very useful tool. And very fast.
Thanks a lot.
Max from Germany.
Hello i like the program but i want to know how can i implement it if the imu gives output data in i2c, of the 3 axis of the gyro and the accel, I have got the data in other algorithm of arduino. What do I have to change in your code?
Pingback: FOG COPILOT Projesi | Model Hobby Projects
Hello. Sry for my bad English. I’m a postgrdauate of the information technology department of the Sakhalin State University. Can u help me with my problem?
I already have data from different sensors: accelerometers, gyroscopes, etc. Data saved in the following format: Time, Gyro X, Gyro Y, Gyro Z, Accelerometer X, Accelerometer Y, Accelerometer Z, Compass X, Compass Y, Compass Z. The data is noisy. I need to cut down on noise and plot to assess the results obtained using a Kalman filter. Help me please modify your program to process the data is not real-time to solve my problem.
Thank you.
Hello…
I want to send data from serial chart to arduino module. can you give me source code of serial chart?
If possible I would like to modify it to be able to send data
Pingback: Arduino code for IMU Guide algorithm. Using a 5DOF IMU accelerometer and gyroscope combo « Starlino Electronics « Mazurland
Starlino, creio que todos os leitores deste site tem uma dívida contigo! Obrigado por dividir seus conhecimentos conosco!
Foi conectar a fiação e rodar o programa que saiu funcionando!
Thank you!
Hi Starlino, very cool projects! I'm doing something very simular to this, but I have a question about the SerialChart application. I'm trying to visualise my 3 gyro axises, but I can only see 2 of them in serialchart… This is the code I'm using for printing:
I also tried with other data, but same results… Am I doing something wrong?
Thanks in advance!
Tim, what is the serial chart configuration file, and can you send sample output from your device ?
This is what I'm getting at the moment, 4 numbers in the output, but only 3 lines visible…
http://www.timdemeyer.be/files/serialchart_output.png
And this is my current serial chart configuration file:
http://www.timdemeyer.be/files/MPU-6050-kalman.scc
Tim your first field is called [interval] and it’s color is transparent, you should remove that section
Oh yes afcourse! All the lines are showing up now. Thanks a lot!
Hello Starlino,
Congratulations guide on IMU and application SerialChart, his explanations are simple and really work!
I'm doing the same job, but with other models of sensors and my question is regarding the complementary filter:
1) In the complementary filter (in the arduino code) is performed a weighted
"RwEst [w] = (RwAcc [w] + config.wGyro RwGyro * [w]) / (1 + config.wGyro);"
that worked perfectly, but I have seen other articles that I talk about complementary filters and saw there another equation of the type:
"angle = (0.98) * (angle + Rwgyro * dt) + (0.02) * (Rwacc);" or
"angle = a * (angle + Rwgyro * dt) + (1-a) * RwAcc"
where a = tau / (t + tau)
you can see that the two forms is given a value greater than one sensor to another. Only I could not see where the variable "a" in your solution, and referred to this time constant than the other articles speak.
Thanks for your time!
Hi every one,
Serial chart is not working ing my PC, is this compatible with Windows Starter?
I tried to use the ZIPPED version, but when i hit the run button it gives me an error message
"Could not open port COM26"
but I am 100% sure that my Arduino is Connected at com26 and I already configure the serial chart.
I also tried to close all the applications running on my PC except Serial chart. But still got the same error.
Can someone Help me..
Clark: the QT serial library has sometimes problems with ports higher then 10 (only on some computers), You can change it to COM4, or something similar , solution is described here:
http://code.google.com/p/serialchart/issues/detail?id=1&can=1
Hi Starlino,
Thank you for sharing your work and sorry to bother you. I'm going mad trying to draw an oriented cube in Labview starting from RwEst values. I've read all the comments here looking for an answer without any success. I've tried calculating pitch an roll angles using these expressions:
But it doesn't work. Could you please show me any way to accomplish this task?
I will be grateful for any help you can provide.
Pablopaolus: Please have a look at the DCM tutorial on this site. If you calculate DCM matrix instead of pitch/roll you could find position of any rotated vector as r’ = DCM * r .
Starlino: Thank you for your quick response. I had already read your DCM tutorial. However, since I found it more difficult to understand, I implemented your simplified Kalman filter algorithm… but it seems I'll have to go for DCM.
By the way, I have a doubt regarding your DCM implementation. Is the code in https://code.google.com/p/picquadcontroller/source/browse/trunk/imu.h?r=7 enough for calculating the DCM matrix? I mean: At imu_update() function I can see you update dcmGyro matrix, but I can't see anywhere the dcmEst calculation, which is defined as the estimated dcm matrix by fusion of accelerometer and gyroscope. In other words: is dcmGyro the matrix I can use to find r'=dcmGyro*r?
Thank you for considering my request.
Pablopaolus: I believe you’re looking at an old code revision (r7), see https://code.google.com/p/picquadcontroller/source/browse/trunk/imu.h
I try Serial Chart software, but it didn't works. I set the configuration like this:
[_setup_]
port=COM18
baudrate=9600
width=1000
height=201
background_color = white
grid_h_origin = 100
grid_h_step = 10
grid_h_color = #EEE
grid_h_origin_color = #CCC
grid_v_origin = 0
grid_v_step = 10
grid_v_color = #EEE
grid_v_origin_color = transparent
[_default_]
min=-1
max=1
[Field1]
color=gray
min=0
max=255
[Field2]
color=blue
[Field3]
color=red
But, the error message appear, it said "Could not Open Port COM18". How to fix this? I use Windows 7 32 bit.
i am currently working on a self balance robot and i want to use a kalman filter for my IMU sensor fusing and filtering and i want the output as tilt angle to input into the PID controller,and i want to convert the PID output angle into speed for my MD49 motor driver.
I know what I want to do but I dont know exactly how to go about it. So I was hoping if you have an idea where i am supposed to start from and how I could do the necessary conversion.
Thank you for your consideration cause I sound like a total novice,which I am.
@mamette
serial chart only works with com prots 1 < 9.
manually change your com port number in windows 7 (you'll need to google that) I had to do it in winXP to get it to work.
Is there a license for the imu arduino?
You can use this code as you wish – just mention the source in your comments or in about dialog in your application.
Hello,
I want to speed up my serial connection for serial chart and getting rid one sprintf
does anyone know the formatting when you set decoder = bin?
if it's just bytes being sent as data, how does serial chart know when it is a new line or end of line?
the advanced features does not explain much, a sample setup file and sent sample data would be nice
thanks,
Daniel, bin decoder is mainly provided for HID (usb) ports where there’s a clear distinction between packets received on the HID (USB) level. For serial port there’s just a continuos stream of data, you may try to introduce a small delay after each packet and use bin decoder code can be altered to issue a new packet only after data was not received for a specified amount of time.
However you may want to look into the HDLC encoded data (decoder = hdlc) , it is similar to bin ,except there’s a dedicated line end character (hdlc_sep) and an escape character (hdlc_esc). There’s liitle overhead compared to bin, however there’s no need to indroduce delay to separate packets.
Hi,
I set decoder=bin, type=byte, and I send one byte repeating to serial chart every 25ms
nothing displays in the data field or graph
not sure what i am missing, please help
(when decoder=csv all works ok)
Daniel
Hi! thank you for your tuto it's really helpful. but i have a little problem, i don't know if if really understood what we do
the thing is that i can't run serialchart an the arduino software at the same time with the same port. when one is already running the other output '' COM3 is used by another application". So i can't really make a real time plot
thanks
Yvan: You can’t open two connections to the same port , this is a windows limitation, you might have to close one of them, or you can use a secondary UART 2 USB converter and have another virtual port if you need to run them both.
Hi!
Can somebody help me?
I have the same project but I have to use Atmega324.
Thank you.
Pingback: BEng Major Project – Quadcopter Flight Controller | FreeIMU Accelerometer Test
Just came across your SerialChart software… wish I would have found it a few years ago, but nonetheless great work! It will be an invaluable tool to my projects in the future!
Pingback: Osprey Flight Controller | FreeIMU Accelerometer Test
Hi there, hopefully you still check these comments ^_^
I'm trying to implement your code on an mbedLPC1768 and it's more or less the same save for the serial outputting and the way I collect the interval time. I am also using an MPU6050 which outputs accelerometer in m/s/s which I can convert to G and the gyroscope in rad/s converted to deg/s.
However I'm having some strange readings. Using the first code you published which outputs the X-axis, I get 0 when it's level, and then approx. 55 to -55 when it should be 90 to -90. Once it starts going upside down, the values decrease back to 0 until it is level but inverted.
I hope you have some insight. Thanks.
Hi!
Serial Chart is a good software..If it can save the data to txt , it'll be much better.
Dear composer,
First, I would like to thank you very much for your kind contributing us a very nice explanation and code for signal detection. By the way, instead of using 5 DOF IMU I am using 6 Axes sensor (type L3G4200) to detect 3 acceleration axes and 3 Gyroscope axes. However, I cannot access to its scheme and code. Also, I want to use SerialChart with it, but I don't know to connect it.
Please kindly help explain more of this process.
My email: kdsovatna@gmail.com
Phon Sovatna
Thank you.
I am just looking at an imu/inu laptop based system. Ive read this work and it has already asked and answered questions that were unknown unknowns a couple of hours ago.
Thanks
Hi, can you share the raw sensor data with me?
I don't have the sensors with me now.. But i want to test the algorithm.. Thanks!
Bill
Sir, basically i tried to run your uploaded [Imu_Arduino_3axis_output_2010-03-18] on arduino uno + ADXL335 analog accelerometer which is connected as
Arduino Accelerometer
Vs = 5v Vcc
GND GND
A0 Xout Pin
A1 Yout Pin
A2 Zout Pin
, when i tilt acceleromter data was represented in serial chart which i have downloaded from your site,
But Graphical chart of acceleroemter data never displayed…….. what problem can be occured, plz help
Folks,
Has anyone ever used SerialChart with Invensense SDK-MPU-9150 ? I am trying to use this with 9150, but running to data format mismatch (data shown in 'data' box of SerialChart – is all garbage binary symbols) . I do not know the format of data sent over blue tooth i/f by 9150 to com port of PC (i.e. to SerialChart) . While I reverse engineer the format, I wanted to try my luck and see if anyone has used SerialChart with 9150 and have resolved the format difference ?
Appreciate any help/advice.
Thanks in advance
Folks,
I am looking to modify, Serialchart for my data format. I have downloaded the source code from the link given above. Could someone please help with build instructions ? I did not see any build/readme, or top level makefile. Would there be any microsoft project/solution file ?
Thanks
Dear Starlino,
Thanks for good Web,
I have question, it is possible for me to display another csv file on the chart rather then only output from gyro?
example: I have data from pressure sensor and humidity to trending it on the serialchart 5 point csv file
1005.50,27.50,64.73,34.00,29.00,84.20
1005.49,27.40,64.81,34.00,29.00,84.20
1005.55,27.50,64.31,34.00,29.00,84.20
1005.50,27.40,64.73,34.00,29.00,84.20
1005.47,27.40,64.98,34.00,29.00,84.20
1005.52,27.40,64.56,34.00,29.00,84.20
1005.52,27.40,64.56,34.00,29.00,84.20
1005.48,27.40,64.89,34.00,29.00,84.20
1005.50,27.40,64.73,34.00,29.00,84.20
1005.53,27.50,64.47,34.00,29.00,84.20
I try directly to serial chart but I dont see anything on it, I attach my serialchart config, thank for your help
[_setup_]
port=COM4
baudrate=9600
width=1260
height=1260
background_color = white
grid_h_origin = 600
grid_h_step = 10
grid_h_color = #EEE
grid_h_origin_color = grey
grid_v_origin = 610
grid_v_step = 10
grid_v_color = #EEE
grid_v_origin_color = grey
[_default_]
min=-1
max=1
[interval]
color=transparent
min=0
max=100000
[1]
color=red
[2]
color=green
[3]
color=blue
[4]
color=yellow
[5]
color=pink
Dear Starlino,
Thanks for good Web,
I have a question on the output that I obtained from my IMU board. I am using SN-IMU5D-Lc.
here is the link : http://cytron.com.my/p-sn-imu5d-lc?search=Imu
Generally I have 2 questions,
1st question:
My IMU have :
Gyro Raw Sensitivity: 0.67mV/°/s
Acclerometer Sensitivity: 300mV/s
I have tried changed both values from your original code but the output I obtaind are getting worse. So I just use the original values from your code. Okay here's my question. Reffer to the reading below:
7652,-0.19,-0.07,-0.23,0.08,0.96,0.99,-4.15
7648,-0.17,-0.07,-0.23,0.08,0.96,0.99,-4.06
7652,-0.19,-0.07,-0.23,0.08,0.95,0.99,-4.06
7648,-0.19,-0.07,-0.23,0.08,0.95,0.99,-4.08
7652,-0.19,-0.07,-0.24,0.08,0.95,0.99,-4.09
7648,-0.19,-0.07,-0.23,0.08,0.96,0.99,-4.08
7652,-0.19,-0.07,-0.23,0.08,0.96,0.99,-4.07
7648,-0.19,-0.07,-0.23,0.08,0.96,0.99,-4.06
7652,-0.19,-0.07,-0.23,0.08,0.96,0.99,-4.06
7648,-0.19,-0.07,-0.23,0.08,0.95,0.99,-4.08
7652,-0.19,-0.07,-0.23,0.08,0.96,0.99,-4.07
7648,-0.19,-0.07,-0.23,0.08,0.96,0.99,-4.07
7652,-0.19,-0.07,-0.23,0.08,0.96,0.99,-4.08
7648,-0.19,-0.07,-0.23,0.08,0.95,0.99,-4.10
7652,-0.19,-0.07,-0.23,0.08,0.96,0.99,-4.08
7648,-0.19,-0.07,-0.23,0.08,0.96,0.99,-4.07
7652,-0.19,-0.07,-0.23,0.08,0.95,0.99,-4.09
7648,-0.19,-0.07,-0.23,0.08,0.95,0.99,-4.10
7652,-0.19,-0.07,-0.23,0.08,0.95,0.99,-4.10
7648,-0.19,-0.07,-0.23,0.08,0.96,0.99,-4.09
7652,-0.19,-0.07,-0.23,0.08,0.95,0.99,-4.09
7648,-0.19,-0.07,-0.23,0.08,0.95,0.99,-4.10
7652,-0.19,-0.07,-0.23,0.08,0.95,0.99,-4.12
The data printed at the most right side is angle projected at plane z,x..which is atan2(RwEst[0],RwEst[2])*180)/PI
This data are obtained when I keep the IMU borad is rest on flat surface. Is there any possibility that I could obtain more precise data from the RxEst?? maybe 0.01 when it rest on flat table? What parameter that I need to configure and play with? Are the value for sensitivities of my gyro and acc are need to be change?
2nd qestion:
Why did I cannot see the result from serial monitor from Arduino software? It display rediculus letter:
Dear Starlino,
I have a print problem with your "Serial Char".
Description: I send data to COM with a C51 MCU, how should i send csv foramt data with C51?
Thanks.
I worked on MPU6050 , it is a 3-axis ACC.and 3- axis GYRO and Temp Sensor , when I tried to just get the tilt information from this sensor , I found it is sense in same time the acceleration which I dont need , Actually I need to read just the tilt in x and y direction . My question is .How can I cancel the acceleration sensing ,
Hi Starlino,
i to am trying to generate a trace from mpu6050. My gyro x,y data quickly draws the 2 traces vertically but they are very slow to move from left to right accross the chart, hence are all squashed up and unreadable compared to other charts ive seen people generate. its like having an oscillocope on a slow timebase of about 1 second/div and all the data is crammed into that time scale. ive tried as a previous post said about adding a delay after each line. I assume this means for example: x_data, y_data (delay) and not x_data, (delay) y_data (delay) and so on. is this the only way to increase the sweep speed?
Code matlab filtre kalman et animation 3d MPU6050
Pingback: Projects related to Kalman filter | Enhancing knowledge in control systems theories and its applications in the real world.
Pingback: Kalman Filter | Enhancing knowledge in control systems theories and its applications in the real world.
Hello. Now, Google Code has shut down, are there any plans to migrate SerialChart to GitHub or similar? Is it still maintained?
Thanks!
There are no “official” changes yet. But once I will have any I will migrate to GitHub. Currently there are many forks that you can find on GitHub https://github.com/search?utf8=%E2%9C%93&q=SerialChart , please note they are not supported by me so use at your own risk. Thanks.
Hello!
I have read your code seriously and you have done a really wonderful job. But I got a question about your code .
————-YOUR CODE—————-
//get angles between projection of R on ZX/ZY plane and Z axis, based on last RwEst
for(w=0;w<=1;w++){
tmpf = getInput(3 + w); //get current gyro rate in deg/ms
tmpf *= interval / 1000.0f; //get angle change in deg
Awz[w] = atan2(RwEst[w],RwEst[2]) * 180 / PI; //get angle and convert to degrees
Awz[w] += tmpf; //get updated angle according to gyro movement
}
—————YOUR CODE—————-
If w=0, Awz[0] means Axz as you define. And Axz(n)=Axz(n-1) +RateAxz(n)*interval. The question is
RateAxz(n) written in your code is RxGyro. But as your article said, it should be RyGyro.
Please tell me why. (I am a fresh man.)
Thanks for your answer.
Zhouqq: Can you please clarify, I am not sure what formula you’re refering to in the article, here is the one I found Axz(n) = Axz(n-1) + RateAxz(n) * T
Yes, the formula is Axz(n) = Axz(n-1) + RateAxz(n) * T. And you use the variable 'interval' to replace T in your code.
My question is : Is RateAxz(n) means RyGyro? If it does, why your code use RxGyro instead of RyGyro?
Thanks.
SerialChart is great.I now try to use it for static and dynamic indentification of motion control systems. My only problem is that, if I want to send a command to my target to start the measurement, I have to use the char: format to end the command with \r\n (necessary for the comand interpreter on the target). Is it possible to sen a string ended by \r\n???
It seems this may have been a useful comment from the old code.google.com hosted site for this code, so repeating it:
Comment by project member sergiubaluta, Jan 21, 2013
Experimental feature to send data back over serial connection, good for sending commands,settings, etc to your device:
Note below Data box ,there's a textbox and Send button.
Example inputs in the textboxe:
adsadasdasd will send ASCII string as typed
char:65,66,67 will send three chars with codes 66,66,67, same as ABC
short:30555,14,55 will send 2-byte short integers , in the above example total 6 bytes will be sent
long:68555,4555 will send 4-byte long integers , in the above example total 8 bytes will be sent
hex:A7ED,1E will send a string that is specified in hex (pairs of 0-F chars), in above example total 3 bytes will be sent
I am successful using the Send Box and 'Send' button, but I had to use the 'hex:' format instead of a simple string. This is similar to comment 145 above from Wijnand. add '\r' in the textbox seems to not work. I took a brief look at the code, probably it is literally sending the '\' and 'r' characters instead of interpreting it as a carriage-return.
So to send to my target the 3 character command: '1d\r', I had to put in the text box: 'hex:31,64,0D' (without quotes)
Similarly, in the [_setup_] of my configuration file, I have the lines
send_run = hex:31,64,0D \\ to start data, send the command 1d\r
send_stop = hex:64,0D \\ to stop data, send the command 0d\r
Mark , which version are you using ? I think the latest one has a \r \n and echo checkboxes before the SEND button. If you can get Qt5 you should be able to compile latest one from github or google code.
I downloaded the self extracting exe yesterday from https://code.google.com/p/serialchart/downloads/list since I don't currently have a windows C/C++ development system installed. Unfortunately the 'Help | About' info box does not contain a version number but I am sure it is rather old, and there are no checkboxes like you mentioned near the Send button. The links on this page for downloading seem even older, the contents of the zip is from 2010. Is there a more recent binary available?
Great program by the way, I am displaying 7 traces together, while skipping over some of my CSV fields.
Hi Starlino….
Can i Add date and time to all readings, this is for show only in data not in chart. how can i configure the script file? it is possible?
Gerardo , there’s no timestamp feature for serialchart yet. But you can generate a timestamp at the source (where data is generated) which would be more accurate since it takes time for data to be transmitted.
Any chance of offering a linux build? And mac for that matter. :)
Regards.
Sorry for being unclear. I meant a build of serialchart for linux and possibly mac.
Regards.
hello Starlino sir
I am undergoing my project titled "data fusion of GNSS and IMU using kalman filter". I am new to arduino and IMU, can you please direct me for programming and interfacing part. Firstly i wanted to interface IMU and Arduino due(SAM3X8E), secondly i want to fuse GNSS data and IMU data using kalman filtering. would you please direct me.
Thank you
Regards
Radhamani N
There’s a good new book on the subject: Kalman Filter for Beginners: with MATLAB Examples
Hi Starlino!
About the serial chart, is there any way to save the graph and label its X and Y axes, instead of printscreen?
Thank you.
solo quiero agradecer por todo el trabajo, tiempo y esfuerzo que fue invertido, lo use y perfecto ningun fallo.
I just want to thank you for all the work, time and effort was invested , I use it and it worked perfect , no fault .
Hi, SerialChart looks very interesting and promising.
I installed it on Windows SEVEN, but it crashes each time i press RUN.
Reading datas coming from Arduino like this 123456,20.55 ( millis + temperature)
My config file :
[_setup_]
port=COM9
baud=9600
[_default_]
min=20
max=40
[interval]
color=transparent
min=0
max=1000000
[temp]
color=blue
What's wrong with it ?
Thanks
how fast is data coming in, try decreasing the data rate if it is coming to fast.
Thanks Starlino,
Datas are coming in every 0.5s only…
Hi Starlino
Thank you for your SerialChart tool! It seems not to be maintained anymore, is it?
Anyway, I ported it to QT5 and made it to work with up to 1 MBaud. If you are interested, I can send you the code/binary.
CaCO3, does it build for linux as well? Do you have the code published somewhere? :)
Reards.
Pingback: PES4 | Andreas' Blog
Hi Starlino,
thanks for your good guide,that was so useful.
but i cant calculate the angel in degree.
I receive numbers between -1 to 1 from serial port, but I don’t know how to convert them to degree.
I want to convert them to degree and use for Quadrotor controller.
please help me…
Hi Starlino,
Just curious why you keep calling it a 5DOF device when the IMU chip you refer to says 6DOF (3 axis accelerometer + 3 axis gyroscope) ?